Install the app
How to install the app on iOS
Follow along with the video below to see how to install our site as a web app on your home screen.
Note: This feature may not be available in some browsers.
You are using an out of date browser. It may not display this or other websites correctly.
You should upgrade or use an alternative browser.
You should upgrade or use an alternative browser.
Excel Find length of side of triangle in Excel
- Thread starter JSK
- Start date
Welcome to the forums Jo.
Having the length of two sides of a triangle isn't enough to calculate the length of the 3rd side, for a non right-angle triangle. You'll also need to know one of the angles.
Thanks Iain for getting back/
Iain and i am trying to format it in Excel, isn't it possible based on the chart where it has an X and Y axis too
") .
.
Ian
Administrator
- Joined
- Feb 23, 2002
- Messages
- 19,883
- Reaction score
- 1,518
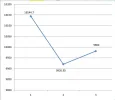
What's the X axis measurements? It just says 1,2 and 3 - which I guess isn't a real value (or is it)? Your "triangle" has lines that cross almost 200 units on the Y axis, but only 1 or 2 units on the X axis.
Is this data coming from cells somewhere?
Is this data coming from cells somewhere?
Ian
Administrator
- Joined
- Feb 23, 2002
- Messages
- 19,883
- Reaction score
- 1,518
I don't know what A, B and C are - it's just numbers. AB is the difference between A and B, but isn't the line length on that graph you've drawn, it's just the difference in height. Same for CB.
If you can explain where you've got this from, I may be able to help.
If you can explain where you've got this from, I may be able to help.
Ian
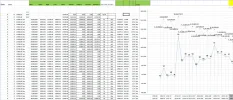
EG: DJI daily data the analysis formulates the base high /low and buy /sell prices
setting targets and stop loss. the base high low is flowing in a triangular format, to analyse it better I am after the third line. attached is the pic . its very good I believe
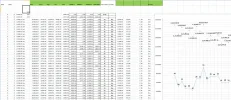
EG: DJI daily data the analysis formulates the base high /low and buy /sell prices
setting targets and stop loss. the base high low is flowing in a triangular format, to analyse it better I am after the third line. attached is the pic . its very good I believe
Attachments
Ian
Administrator
- Joined
- Feb 23, 2002
- Messages
- 19,883
- Reaction score
- 1,518
Ask a Question
Want to reply to this thread or ask your own question?
You'll need to choose a username for the site, which only take a couple of moments. After that, you can post your question and our members will help you out.