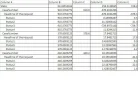
I have created a pivot table in Excel 2007 with data and there are 4 Row Labels, so the information shown in the table is nested. I then have various calculations out to the side. If I copy and paste this data onto a new page, I can then hide the values I don't need to see based on the text in column A. However, I need to be able to easily hide the statuses/group these items, like in an outline. Or possibly have a macro which hides/unhides them?, but the data will change each time I update it and the number of statuses for each case is not constant or consistent. I have taken a screenshot of what it looks like after I add columns C and E (they are copying columns B and D based on if column A contains "Case", I then manually hide columns B and D). The statuses are nested into the Headline, which is nested into the CaseNumber, nested into the State - but all in Column A.
How can I group these into an outline format where they can be easily collapsed and show the State, CaseNumber, Headline only, with the option of expanding to show the statuses on a case by case basis?
Thank you for any suggestions.
Thanks,
Sunny
How can I group these into an outline format where they can be easily collapsed and show the State, CaseNumber, Headline only, with the option of expanding to show the statuses on a case by case basis?
Thank you for any suggestions.
Thanks,
Sunny
Attachments
Last edited: