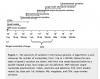
Can someone help me plot this figure from the respective publication as a graph??
Attachments
Screen shot 2012-02-08 at 12.00.24 PM.png
107.3 KB · Views: 212
Ask a Question
Want to reply to this thread or ask your own question?
You'll need to choose a username for the site, which only take a couple of moments. After that, you can post your question and our members will help you out.