Hi guys
I've got a question that may seems to be really simple, but I've been working on it for ages,
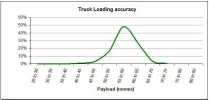
Basically i got a chart that is produced in accesss (refer to the first image),
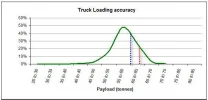
And i want to add another line which represent the critical line and limit line. (refer to 2nd image)
I know this shouldnt be too hard if we have to do it on Excel, (just add another series and plot it) but I just dont know how to do it in Access,this is the problem that i have:
I've got a question that may seems to be really simple, but I've been working on it for ages,
Basically i got a chart that is produced in accesss (refer to the first image),
And i want to add another line which represent the critical line and limit line. (refer to 2nd image)
I know this shouldnt be too hard if we have to do it on Excel, (just add another series and plot it) but I just dont know how to do it in Access,this is the problem that i have:
- How do you plot more than one series in access?
- How do you edit your charts, i know to do make some changes to the formatting but just couldnt figure it out how to changes the data
we can manually edit on "datasheet" but thats not connected to the database